

The United States is historically a nation made up of immigrant families, and not much about that has changed in recent years. People come from all over the world in order to live in the United States.
It is interesting to note where American immigrants come from and where they go. It is also compelling to observe how many immigrants are able to become citizens or legal noncitizens, how many immigrants are not granted citizenship, as well as how many immigrants are awarded temporary visas.
Read on to learn more about United States immigration data and statistics.
Where Do Immigrants Come From?
According to the National Conference of State Legislatures, during the year 2017, there were a total of 278.8 million native-born United States citizens, 20.7 million naturalized citizens, 13.1 million legal noncitizens, 11.3 million unauthorized immigrants, and 1.7 million immigrants with temporary visas. The total U.S. population in 2017 was 322 million people.
People travel far and wide from every corner of the planet in order to seek refuge in the United States.
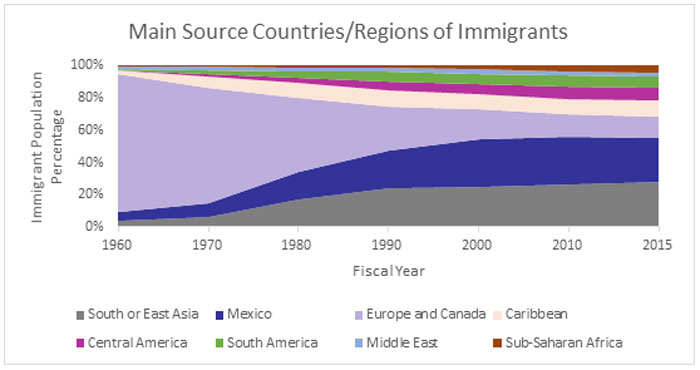
As observed in the graph above, during the 1960s, the largest number of immigrants traveled from Europe and Canada to the tune of more than 8 million people. Over time, that has changed significantly. Now, the largest number of immigrants travel from South or East Asia (over 12 million) and Mexico (over 11 million).
In addition, the United States has seen a dramatic spike in the number of immigrants that come from the following regions:
- The Caribbean
- Central America
- South America
- The Middle East
- Sub-Saharan Africa
Who Gets Citizenship and How Long Does it Take?
If you’ve ever dealt with immigration law, you know that becoming a citizen of the United States is not always an easy or speedy task.
There are different ways immigrants can obtain citizenship in the United States. The following list provides the various methods immigrants may use in order to attain naturalization, as well as the number of people in each category that were granted lawful permanent resident status in 2017:
- Family and immediate relatives - 748,746
- Employment - 137,855
- Refugees and asylees - 146,003
- Diversity and other methods - 94,563
- Total number of visas issued - 1,127,167
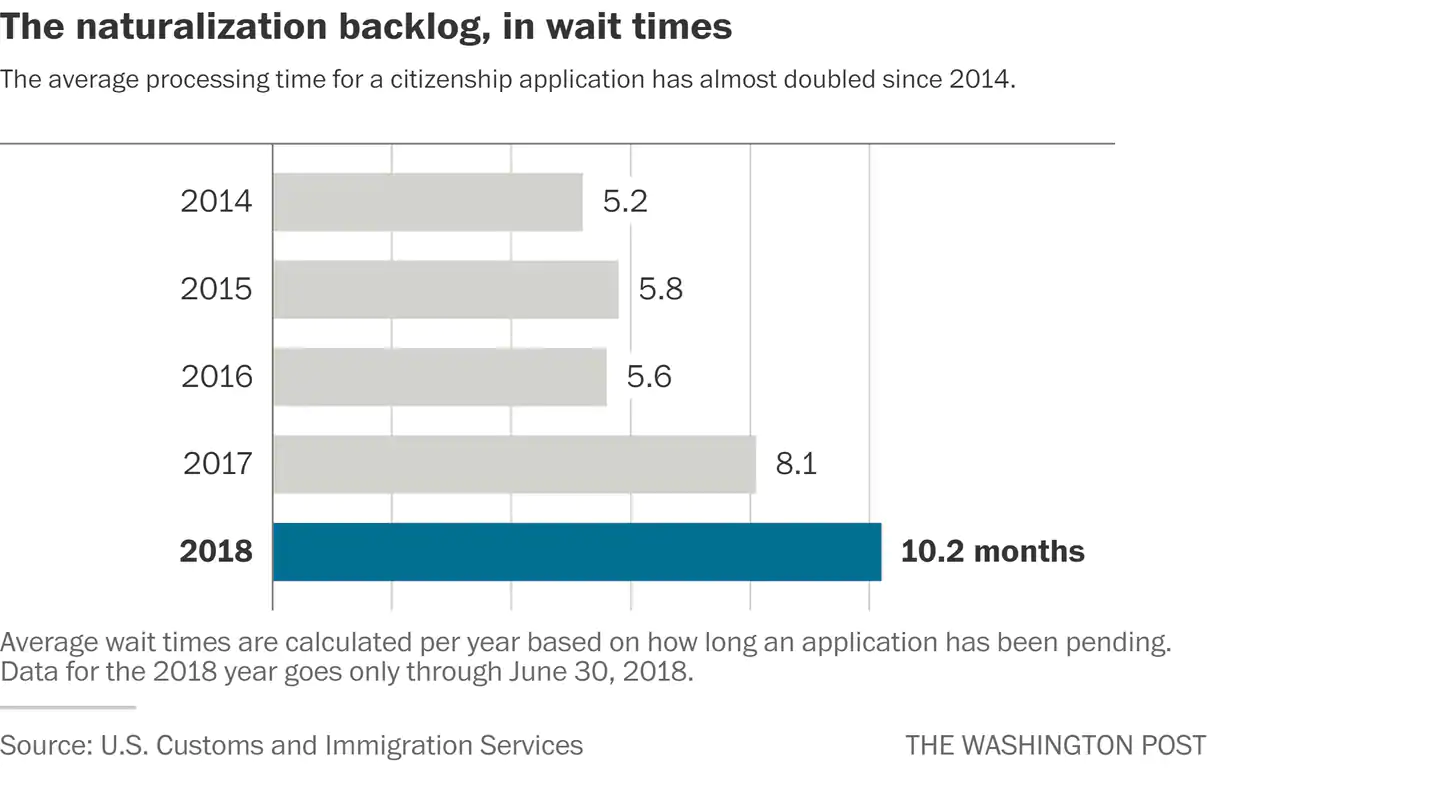
Prior to the year 2016, it took an average of 6 months for foreign-born nationals to obtain citizenship. As seen in the below graph, in 2018, the average wait time to obtain citizenship nearly doubled to over 10 months.
In addition to longer wait times for naturalization, the number of backlogged citizenship applications has also sharply increased since the end of 2016. As observed in the graph below, the number of backlogged citizenship applications has more than doubled since 2013.
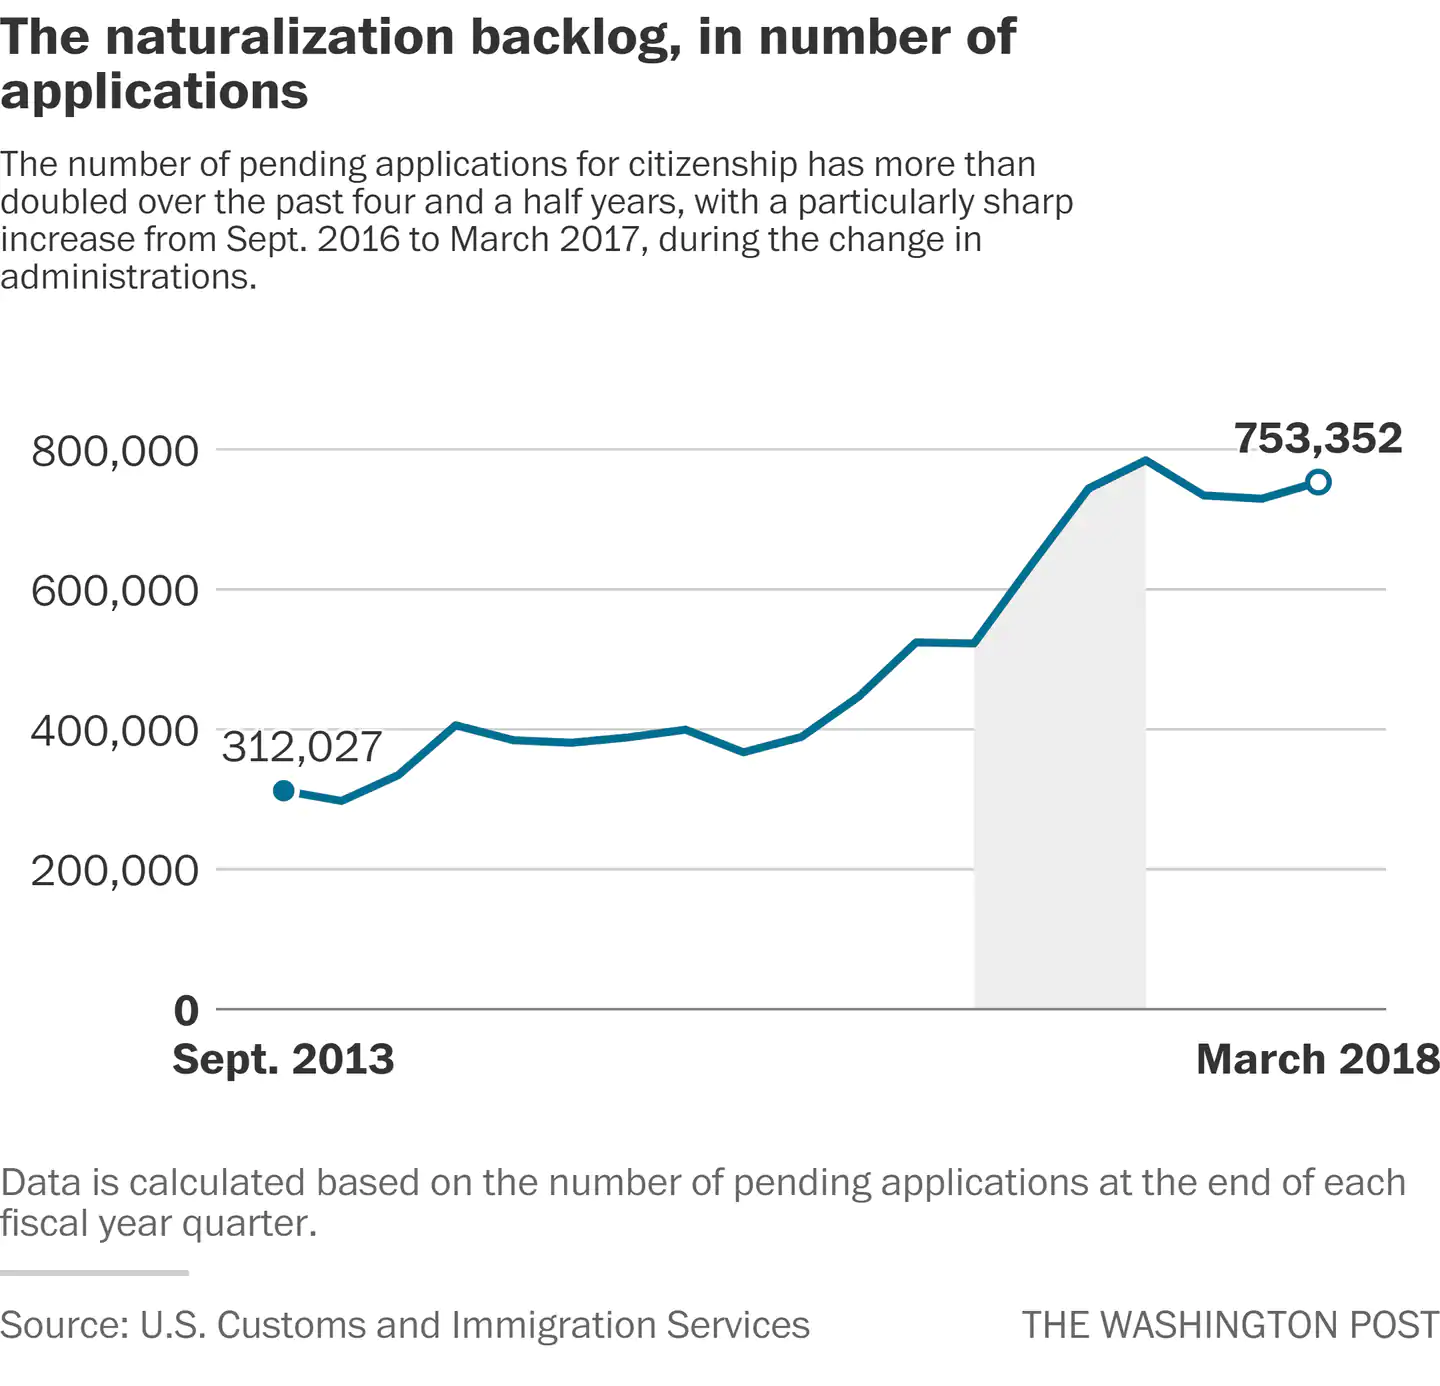
Furthermore, the immigration application backlog rate is even higher in immigrant-rich regions, like Washington, D.C., and Maryland, where people are likely to wait 16 months or longer.
Part of the reason for these backlogs and longer wait times is that harsher guidelines have been instituted since 2014 for immigrants who’d like to obtain citizenship. The United States Citizenship and Immigration Services (USCIS) office extended the citizenship application document from 10 to 21 pages in 2014.
Among other additional information, the USCIS office would now like to know if immigrants have ever been involved in insurgent groups or if they’ve ever been tied up with (or a target of) genocide.
The additional questions create longer wait times since every question on the written application is also asked by a USCIS officer in person at the time of the citizenship interview. These verbal interviews used to last about 30 minutes. Now, they usually take twice as long.
Similarly, the USCIS office is now explicitly rejecting applications that are missing items, instead of notifying the applicant of their mistakes so they may correct them.
Refugees and Asylum Seekers
During the year 2017, there were a total of 53,716 refugees admitted to the United States. A year later, in 2018, that number dropped by over half to just 22,491.
The majority of refugees came from the Democratic Republic of Congo (35%), Myanmar (16%), Ukraine (12%), Bhutan (10%), and Eritrea (6%). According to the UN Refugee Agency, children younger than 18 years old made up around half of the refugee population during 2017. In addition, women consisted of about half of the refugee population.
During 2016, a total of 20,455 people were approved for asylum in the United States, which was a drop of 22% from the previous year (26,124). In 2016, the majority of asylum seekers traveled from China (22%), El Salvador (10.5%), Guatemala (9.5%), Honduras (7.4%), and Mexico (4.5%).
Unapproved Immigration
During 2016, it was estimated that about 11.3 million unauthorized immigrants were living in the United States. The majority of these people originated from Mexico (53%), El Salvador (6%), Guatemala (5%), Honduras (3%), and China (3%).
A total of 699,350 immigrants were granted deferred status under the Deferred Action for Childhood Arrivals Program (DACA) as of August 2018. That same year, 54% of the people who were eligible for DACA applied to the program. Similarly, no less than 317,000 immigrants have obtained deferred status out of Temporary Protected Status.
If you are an immigrant who seeks citizenship, a Green Card, any kind of visa, or anything else concerning immigration in the United States, we may be able to help. The attorneys at Maney | Gordon | Zeller are highly skilled in immigration law and have helped people just like you with their citizenship goals. Don’t hesitate to contact our office right away about your case.
Call Maney | Gordon | Zeller today at (800) 708-4399 to speak with an attorney about your case.


